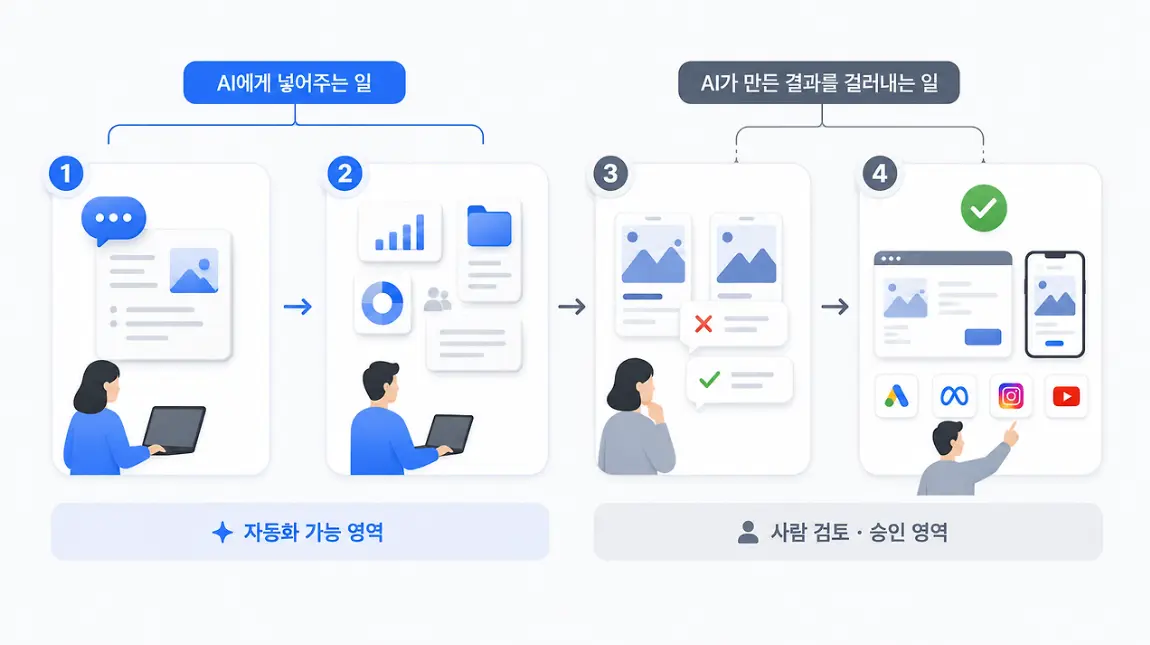
Measuring AI usability means checking whether work has actually changed, not how many tokens a team consumes. Usage climbs easily from long inputs, long answers, repeated retries and drawn-out conversations, so the team with the highest token count is not necessarily the team getting the most value (Mobiinside, as of October 28, 2026).
Why do token counts inflate?
Kim Young-hak, CEO of career school Ijik School, points to four drivers of usage:
| Driver | Why usage rises |
|---|
| Long inputs | Whole documents get pasted in |
| Long answers | Output is more detailed than the task needs |
| Retries | The answer misses, so the prompt is rewritten again and again |
| Long conversations | Topics pile up in one thread and earlier context is resent every turn |
Retries and long threads can be signs of poor use rather than heavy value. If teams are ranked by usage, inefficiency ends up being rewarded.
What should you measure instead, and in what order?
Measurement should deepen in four steps:
- Usage: how much the tools are used. Useful only as a starting point.
- Topics and frequency: which tasks AI is used for, and how often.
- Depth per topic: whether people stop at first drafts or hand over analysis and review as well.
- Change in work: whether time spent and output quality actually moved.
The column's example: if a monthly report that took two days now takes half a day, that is step-four evidence.
What should each role do?
- Leaders should say clearly that this is measurement, not evaluation, so people do not hide their usage. They also need to pick the goal: revenue, profit or cost.
- Team leads should place a before-and-after comparison table next to every usage sheet.
- Practitioners should log one line per use: where they used AI, where it worked and where it did not.
One test question sums it up: did last quarter's report contain a sentence saying "AI changed this task in this way"?
Takeaways for marketers
Marketing teams already track the right units. Creative production time, report preparation time and the number of copy tests run per month are all existing metrics. Split each one into before and after AI adoption and the impact becomes visible without building a new usage dashboard. Adding one column to the metrics you already own is faster and more honest than inventing new ones.
For how agencies are turning AI into a business unit, see Publicis' Marcel Gets a CEO as Agentic AI Drives Growth. For the risk side of running AI at scale, read AI Operational Risks: Lessons From Meta and Grok.
Source: Mobiinside